What does Spring selling season look like in lockdown?
Contact
Aug 19, 2021
What does Spring selling season look like in lockdown?
Less than two weeks out from the spring selling season of 2021, lockdown conditions are in place across the ACT, Greater Melbourne and NSW. More recently, major centres across the Northern Territory have been plunged into a snap lockdown. By Eliza Owen, Head of Research Australia at CoreLogic.
-
 CoreLogicEliza Owen, Head of Research Australia at CoreLogic.
Less than two weeks out from the spring selling season of 2021, lockdown conditions are in place across the ACT, Greater Melbourne and NSW. More recently, major centres across the Northern Territory have been plunged into a snap lockdown.
In the decade prior to COVID-19, sales and listings volumes would typically rise from September to November. The seasonal impact on prices is fairly marginal, as both buyer demand and property supply would increase over the season.
The tables below show the percentage difference between average sales and listings numbers through each of the seasons over the past decade, and the average for the entire decade. In this instance, the numbers reflect the ten years to December 2019, prior to COVID-induced lockdowns across Australia.
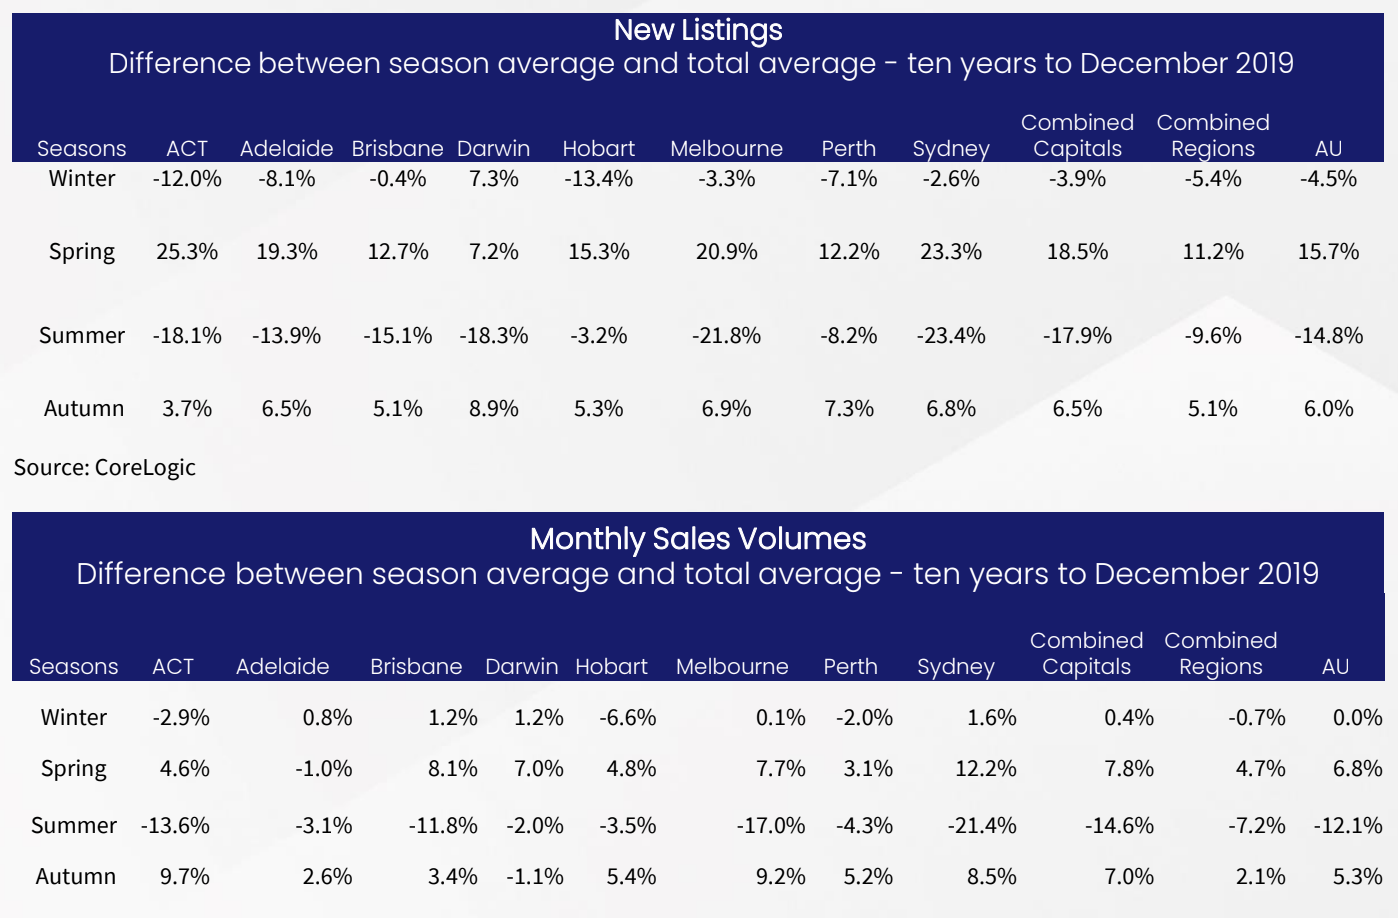
Figure 1. Percentage difference between decade average sales and listings, and decade average by season
The data shows that on a monthly basis, new listings added to the market for sale increased 15.7% nationally compared to the full decade average (where new listings are advertised stock that has been freshly added to the market over the course of the month). This equates to a historic average of around 42,100 new listings added to the market monthly over the past decade, compared with 48,700 through months of spring.
Sales volumes do not see as strong a seasonal effect, with around 40,000 transactions across Australia through the months of spring, compared with 37,500 across the full decade average. Both sales and listings tend to be most seasonal in the capital cities rather than the regions, with the uplift in new listings volumes particularly strong across spring time in Sydney and the ACT. In order to understand what this means for regions now in lockdown, some insight can be gained from housing market outcomes through Melbourne last year.
Lessons from 2020 lockdowns
Observing housing market performance through lockdowns reveals that both sales and listings volumes will fall through lockdowns. This means transaction activity is likely to be subdued across Melbourne, the ACT and NSW through the duration of the current lockdowns. Greater Melbourne was subject to a second wave of restrictions in 2020, from mid-July to late October, well into the spring of 2020. The chart below compares the rolling 28-day count of new listings added to the market over the year, compared with the previous five year average, and 2021.
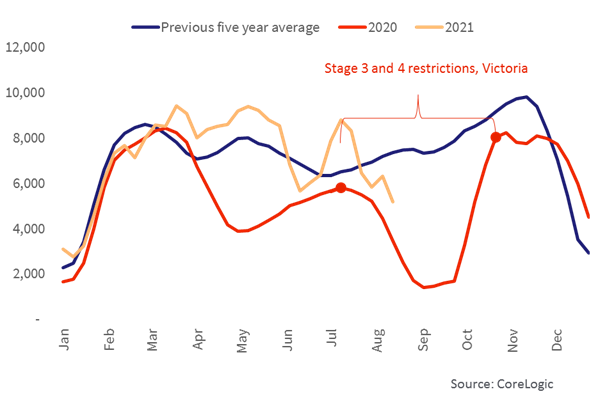
Figure 2. Rolling 28-day count of newly advertised property - Melbourne
The chart shows a rapid and substantial reduction in new listings being added to the market over the course of the lockdowns through the second half on 2020, at a time when new listings would usually be rising consistently. At its lowest count, just 1,411 listings were added to the market for sale in the four weeks to September 6th, which was 80.7% below the previous five-year average.
A combination of factors led to depleted listings in lockdown, including:
- Low levels of consumer confidence, and the belief that vendors may not get an optimal price for the sale of their property
- Mortgage repayment deferrals and government household support, which limited the sale of distressed property – ie, less people were forced to sell
- Property being harder to transact, as inspections and auctions were increasingly conducted virtually.
The views expressed in this article are an opinion only and readers should rely on their independent advice in relation to such matters.
This article was first publsihed by CoreLogic.
Similar to this:
Building demand drives 1.4% quarterly increase in Australia’s housing construction costs - CoreLogic
CoreLogic auction market preview
Australian residential auction market records busiest period since 2017 - CoreLogic
Contact Details:
Contact details:
Eliza Owen
Head of Research Australia, CoreLogic
Email
45016
38726
Eliza Owen


